

The Most Important Chart In The World!
And just like that, the calendar turned to October and volatility picked up in a big way, with three consecutive 1% moves for the S&P 500 Index to start the month. This month gets a bad rap for being a bearish month (it isn’t), but it absolutely owns the title as the most volatile month.
It took nearly a full year, but the S&P 500 finally had its first 5% pullback of 2021, thus ending hopes of 2021 joining 1954, 1958, 1964, 1993, 1995, and 2017 as the only years to go a full calendar year without a 5% move lower.
“Volatility is the price of admission,” explained LPL Financial Chief Market Strategist Ryan Detrick. “Sure, we’d all prefer stocks go straight up forever, but that isn’t reality. Investors must learn to embrace and accept the eventual scares and bouts of volatility that are common even in the strongest bull markets.”
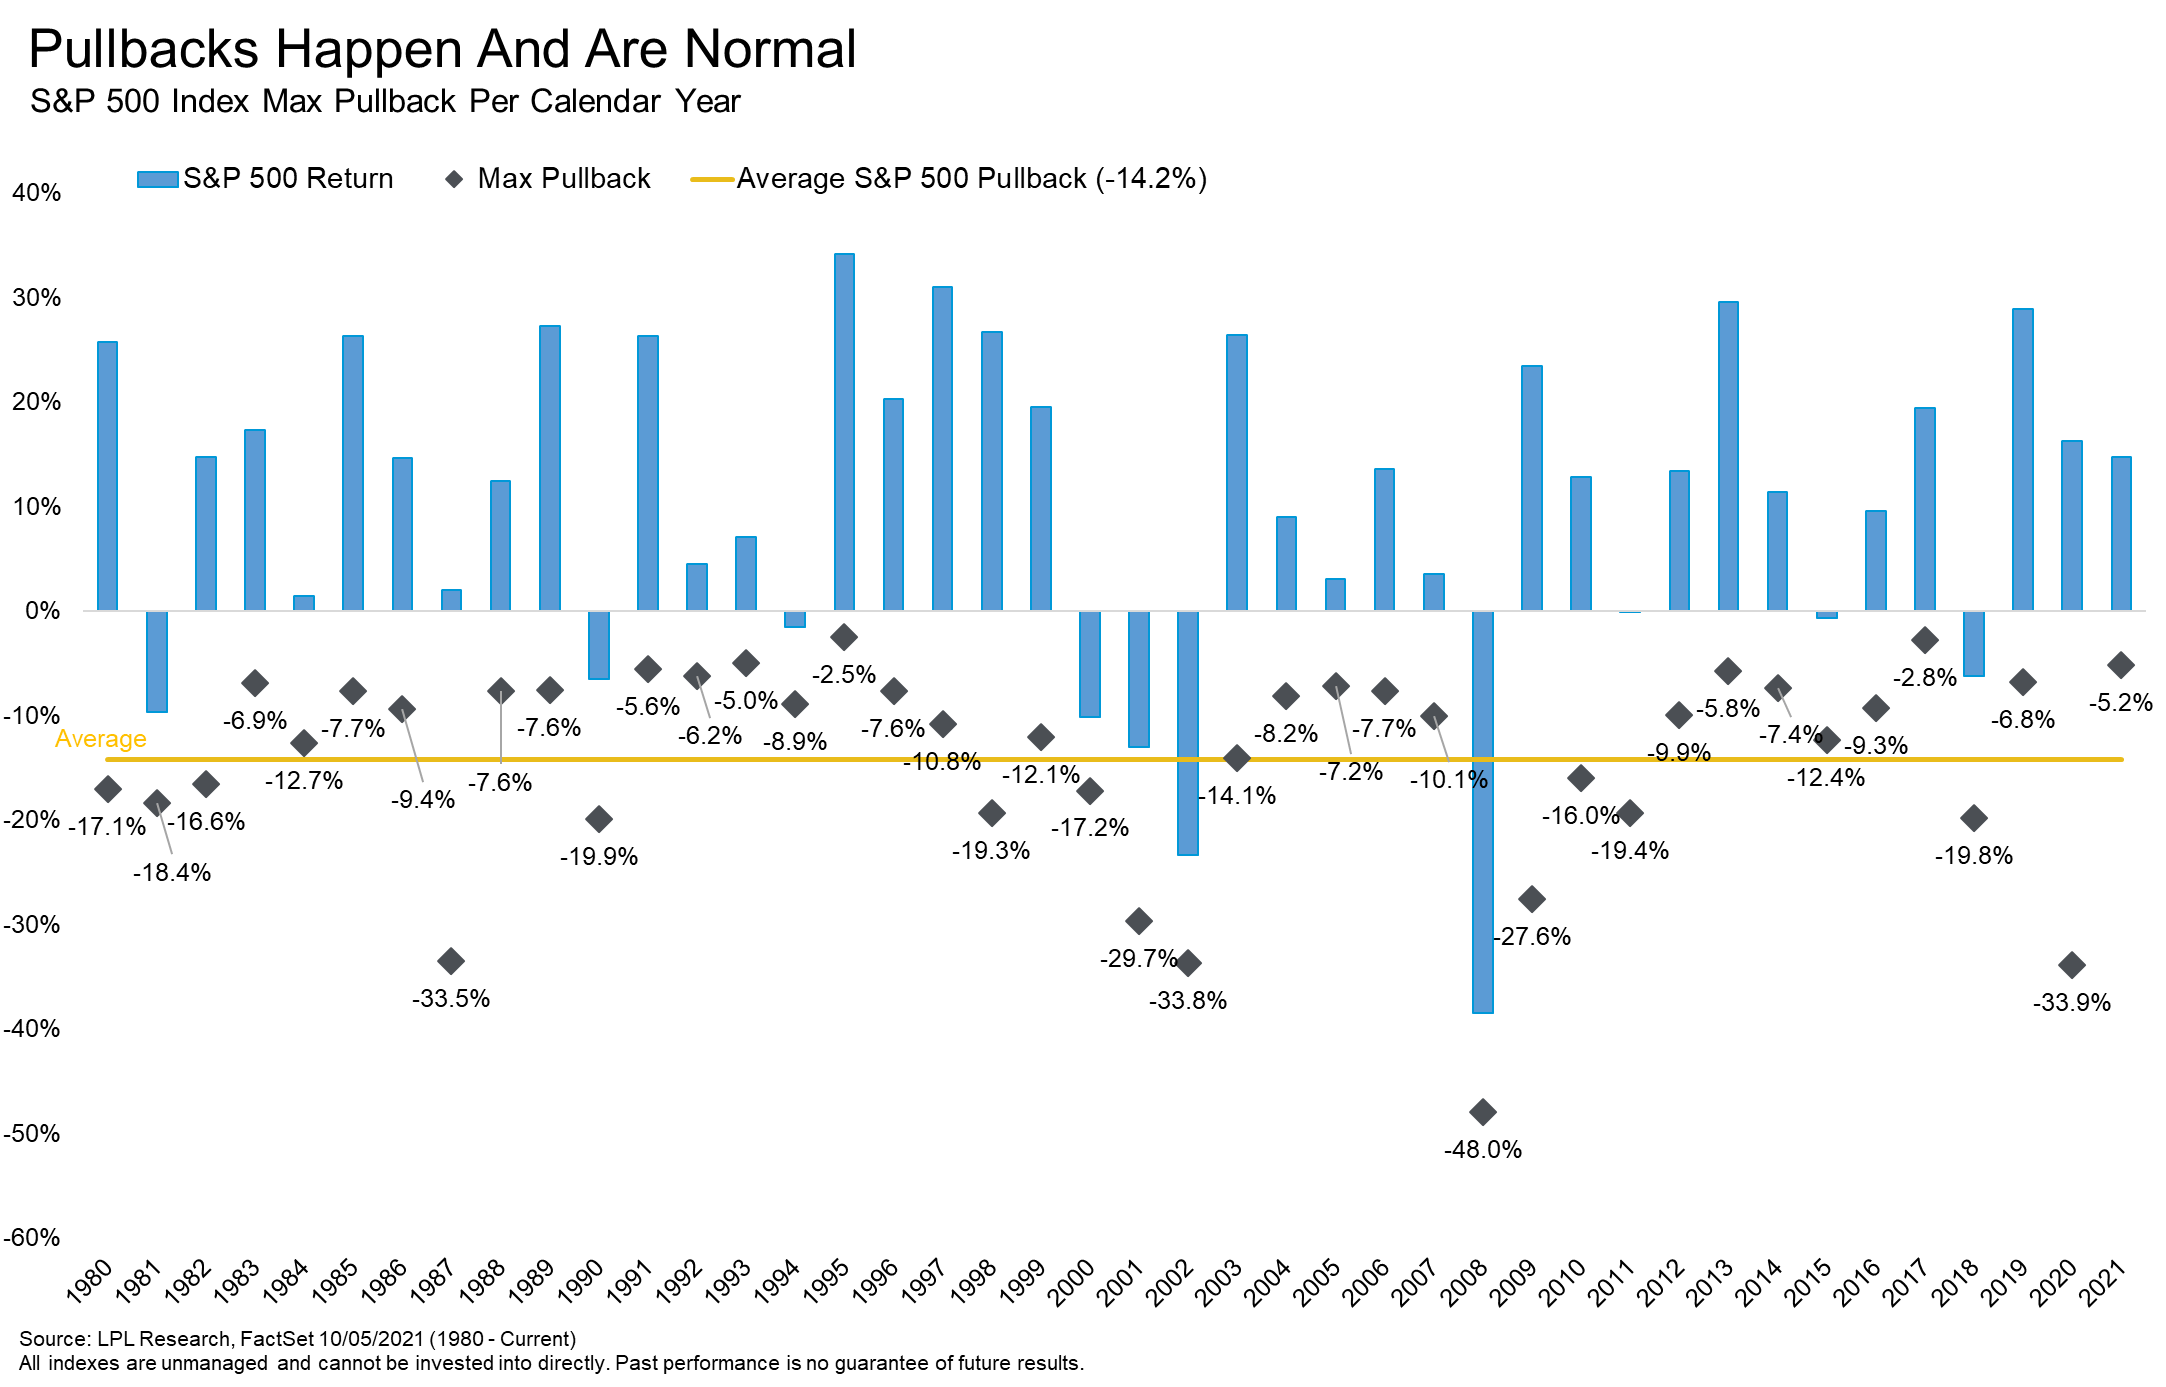
As shown in the LPL Chart of the Day for October 6, below, since 1980, stocks experience a 14.2% peak-to-trough pullback on average during the year, putting the recent 5% pullback in perspective. In fact, 21 out of the past 41 years saw at least a 10% correction. Incredibly, 12 of those years finished in the green and those 12 years gained an average of 17.0%. Who could forget last year’s 34% bear market and move back to up 16% by the end of the year? In other words, big pullbacks can happen even in years that see outsized gains, which is why this chart is so important for investors.
The last new all-time high for the S&P 500 was on September 2, but as of the end of September there were still 54 new all-time highs in 2021, the second most ever with one quarter to go. The good news? Previous years that saw a lot new highs the first three quarters usually had strong performance the final quarter.
Taking things a step further, this year the S&P 500 produced one of its best ever year-to-date gains through September, up 14.7% with a quarter to go. It turns out that good starts to a year tend to resolve higher. In fact, 9 of the past 10 years the S&P 500 was up at least 12.5% with a quarter to go there were further gains in the fourth quarter.